
Analytics
See the bookings you're winning.
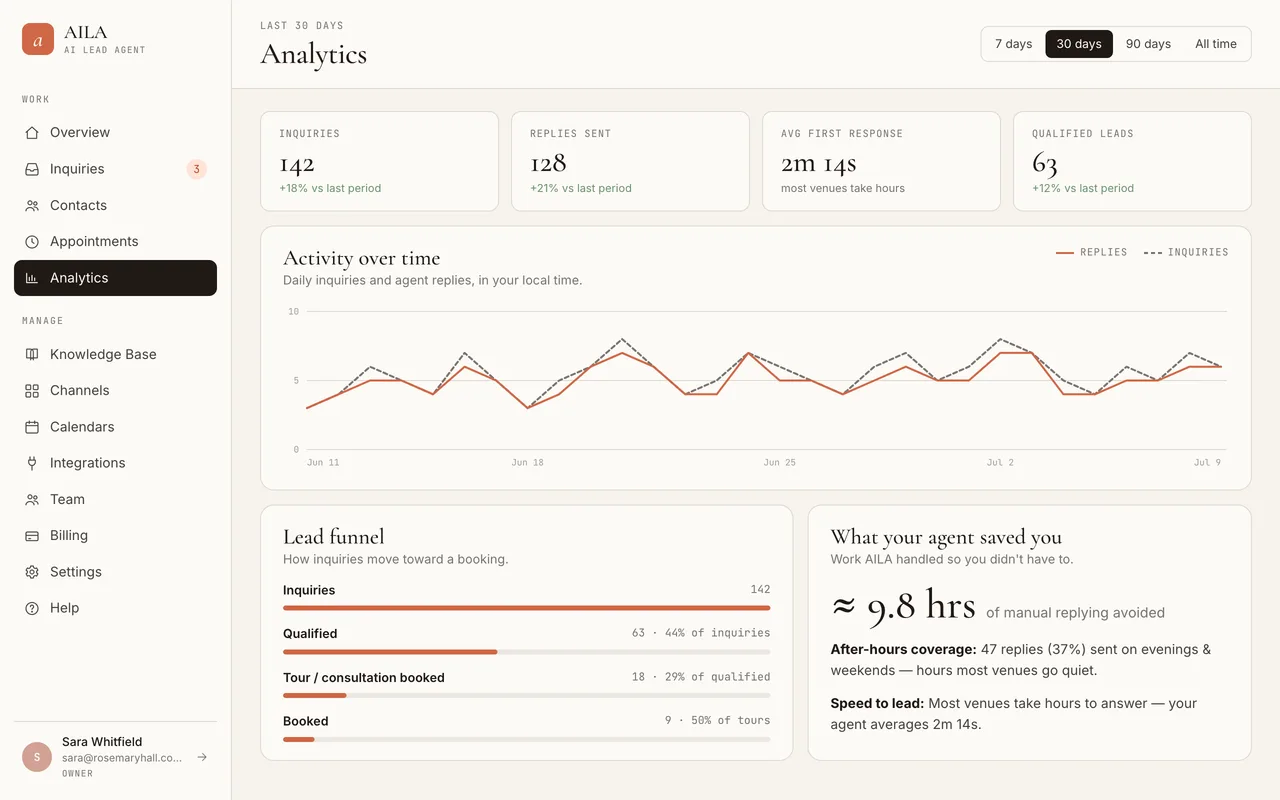
AILA's analytics show an event venue the full path from inquiry to booking: how many inquiries came in, how fast they were answered, how many became qualified leads, how many tours and consultations were booked, and how many follow-ups revived a quiet lead.
- Inquiries Every channel
- Qualified Details captured
- Tour booked On your calendar
- Booked The one that matters
The funnel that matters.
Inquiries → qualified → tour booked → booked, with conversion at every step. Not vanity metrics, but the pipeline you actually run.
Time back for your team.
An estimate of the manual replying hours AILA took off your plate, replies sent on evenings and weekends while your team was off the clock, and your average first-response time. See where AILA is handling the routine replies, so more of your team's time can go into tours and consultations with the people who close the business.
Trends you can act on.
Daily inquiry and reply trends, inquiries by channel, and your reply-pool usage at a glance.